

High-Crime Hotspots in the Greater Toronto Area (GTA) — What the Latest Police Data Shows (2024–2025)
A fact-based guide to higher-crime patterns across the GTA. We combine Toronto Police neighborhood rates, regional dashboards, and Statistics Canada’s 2024 Crime Severity Index to explain where and why risk concentrates—and how communities are responding.

- Introduction
- Quick Summary / Key Takeaways
- Background & Why This Matters Now
- How We Define “Higher-Crime Areas”
- What the Data Shows (2024–2025 Snapshot)
- Why Hotspots Form (and Shift)
- Responsible Reporting
- Practical Safety Tips (Based on Data Patterns)
- Comparisons & Use Cases
- Common Questions (FAQ)
- Sources
- Security Glossary (2025 Edition)
Introduction
Public safety isn’t evenly distributed. Certain corridors, retail zones, and transit hubs in the Greater Toronto Area (GTA) see repeated clusters of assaults, robberies, auto thefts, and break-ins.
ArcadianAI analyzed the latest Toronto Police Service (TPS) neighborhood-level data, plus reports from Peel, York, Durham, and Halton police, to produce a fair and transparent view of current trends.
The goal: help residents, property managers, and businesses understand patterns—not stigmatize communities. Our data includes 2024–2025 police statistics, Statistics Canada’s Crime Severity Index (CSI), and live dashboards from local forces.
Quick Summary / Key Takeaways
-
Crime varies by micro-location and time, not identity.
-
TPS neighbourhood rates reveal measurable variation across Toronto’s 158 areas.
-
Peel, York, Durham, Halton police publish open dashboards and annual reports—always cite them.
-
The 2024 CSI shows severity trends across the Toronto CMA.
-
Hotspots often align with transit hubs, retail corridors, and large parking lots (auto-theft clusters).
Background & Why This Matters Now
Canada’s police-reported crime rate fell by 4 % in 2024, according to Statistics Canada, yet local patterns vary dramatically.
In the GTA, some categories such as auto theft and break-and-enter continue to climb.
The Toronto Police Service Major Crime Indicators Dashboard updates weekly, showing where incidents fluctuate. Meanwhile, the Neighbourhood Crime Rates dataset normalizes crimes per 100 000 residents—making neighborhood comparisons possible without sensationalism.
How We Define “Higher-Crime Areas”
To stay objective, ArcadianAI used three transparent criteria:
-
Toronto (city): Ranked TPS Neighbourhood Crime Rates (per 100 000) for each Major Crime Indicator (MCI) and marked the top 10 % of neighborhoods for that category/year.
-
Surrounding Regions: Reviewed Peel, York, Durham, and Halton annual reports and dashboards, identifying category-specific hotspots (auto theft, robbery, B&E).
-
Regional Severity: Applied the 2024 CSI for the Toronto Census Metropolitan Area to gauge overall severity.
Always state the year and category when discussing risk. Example: “2024 auto-theft rate.”
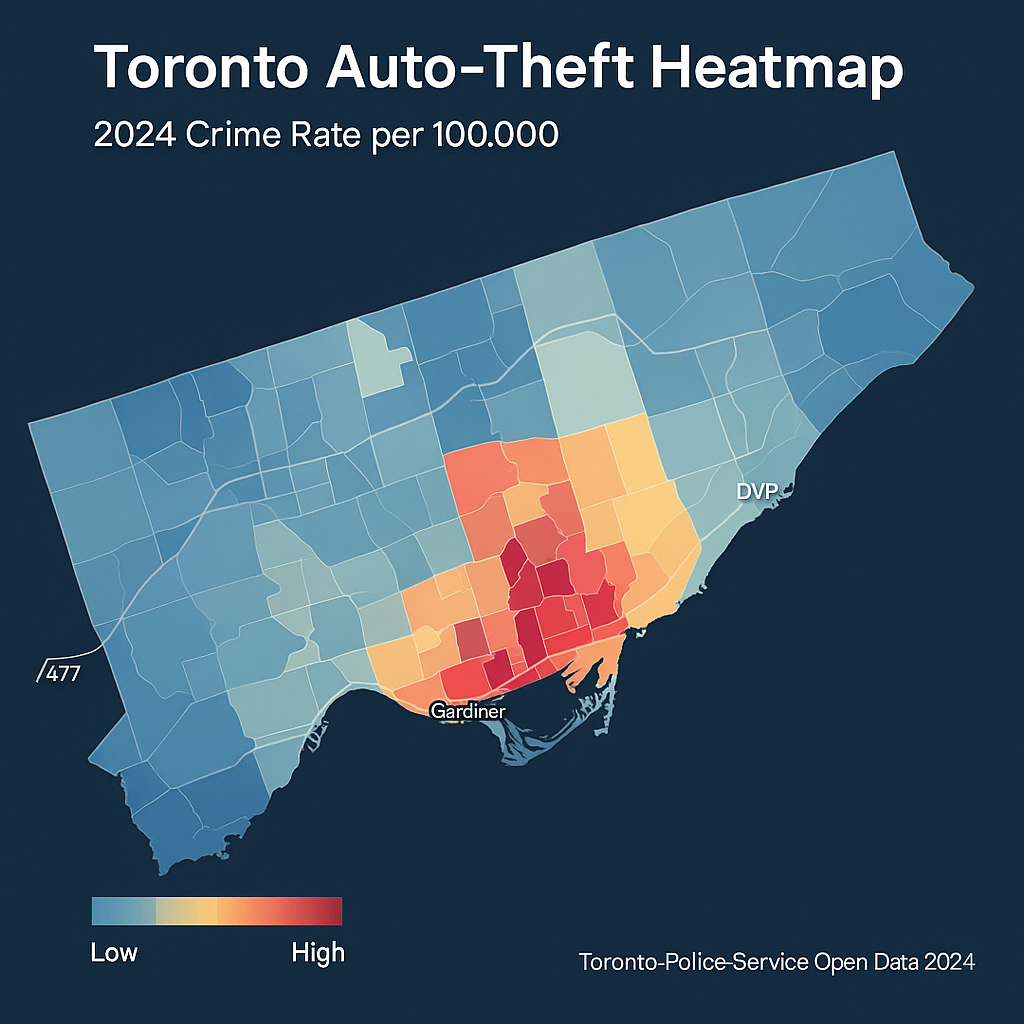
What the Data Shows (2024–2025 Snapshot)
Toronto
-
Persistent clustering near major transit interchanges, downtown retail, and night-time economy zones.
-
2024 data shows auto-theft and theft-from-auto remain among the highest-growth categories.
-
The Neighbourhood Crime Rates dataset enables category-specific analysis rather than labeling any community “dangerous.”
Peel Region (Mississauga / Brampton)
-
2024 Annual Report highlights targeted operations reducing pharmacy robberies and seizing illegal firearms.
-
Auto-theft task forces are focusing on high-value SUVs and shipping-port routes.
York Region
-
2024 Annual Statistics Report breaks down offences per 100 000 population with five-year trends—excellent for tracking spikes versus structural change.
Durham Region
-
Monthly Crime & Traffic Dashboard plus Power BI maps visualize violent vs. property-crime clusters, especially along Highway 401 corridors.
Halton Region
-
Still one of Ontario’s lowest overall crime regions, but saw short-term increases in vehicle thefts and residential break-ins in 2024.
Why Hotspots Form (and Shift)
-
Opportunity structures: large parking lots, easy highway access, high-value vehicles.
-
Activity nodes: nightlife, transit, retail—high human flow equals more targets.
-
Seasonality: B&E and theft-from-auto rise in colder months; dashboards help track timing.
Responsible Reporting
ArcadianAI and public-safety experts agree: focus on data and solutions, not blame.
Use rates and deciles, not “worst” labels.
Highlight community-policing wins, lighting improvements, and technology adoption (AI video analytics, license-plate recognition, real-time alerts).
Practical Safety Tips (Based on Data Patterns)
-
Vehicles: park in well-lit, camera-covered lots; use steering-wheel/OBD locks; shield key-fob signals.
-
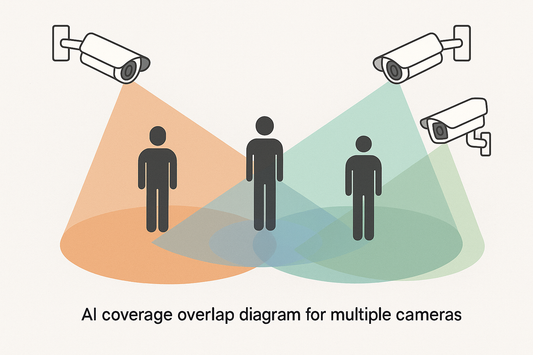
Residences: maintain access control, adequate lighting, and video coverage at all entries and parkades.
-
Travel & Transit: keep phones visible only when needed; remain alert near crowded hubs.
-
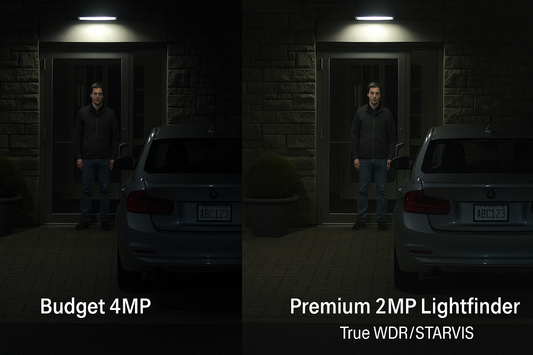
Business Owners: adopt cloud-native, AI-driven surveillance like ArcadianAI Ranger for real-time anomaly detection and false-alert reduction.
Comparisons & Use Cases
| Region / Service | Data Access | Notable 2024 Trends | Reporting Frequency |
|---|---|---|---|
| Toronto (PD) | MCI Dashboard + Neighbourhood Rates | Auto theft + Theft-from-auto rise | Weekly |
| Peel PD | Annual Report + Map | Robbery decline, firearm seizures | Annual + Live Map |
| York PD | Statistics Report | Stable violent-crime rate | Annual |
| Durham PD | Power BI Dashboard | Property-crime clusters | Monthly |
| Halton PD | Annual Report | Low rates, slight vehicle-theft uptick | Annual |
Common Questions (FAQ)
How is a “high-crime area” defined?
By rate per 100 000 population in a given offence category, not by stereotype.
Is the GTA safer or riskier now?
Overall crime declined 4 % in 2024 nationwide, but certain categories (notably auto theft) rose locally.
Where can I view current stats?
Toronto: TPS Major Crime Indicators Dashboard.
Peel, York, Durham, Halton: each offers public dashboards and annual reports on their official sites.
Why not name the “most dangerous” neighbourhood?
Because crime is dynamic; responsible analysis avoids stigmatizing entire communities.
Sources
-
Toronto Police Service (TPS): Major Crime Indicators Dashboard | Neighbourhood Crime Rates
-
Peel Regional Police: Crime Mapping & 2024 Annual Report
-
York Regional Police: 2024 Annual Statistics Report
-
Durham Regional Police: Crime & Traffic Dashboard
-
Halton Regional Police: 2024 Annual Report
-
Statistics Canada: Crime Severity Index 2024
Security Glossary (2025 Edition)
Auto Theft — Theft of a motor vehicle; often clusters near highways or large lots.
Break-and-Enter (B&E) — Unlawful entry to commit a property offence.
Clearance Rate — Percentage of cases solved or closed by police.
Community Safety Strategy — Combination of enforcement, prevention, and design changes to reduce risk.
Crime Severity Index (CSI) — National metric weighting crimes by seriousness to compare overall severity.
CPTED (Crime Prevention Through Environmental Design) — Reducing crime opportunities through lighting, sightlines, and access control.
Hotspot — Small location with repeated incidents due to opportunity structure.
Major Crime Indicators (MCI) — Toronto Police categories: assault, robbery, B&E, theft-from-auto, auto theft.
Neighbourhood Crime Rate — Number of incidents per 100 000 residents in a given neighbourhood.
Spatial Concentration — Clustering of offences in limited geographic areas.
Temporal Spike — Short-term surge in incidents (e.g., seasonal auto theft).
Theft-from-Auto — Property stolen from inside a vehicle.
Rate vs Count — “Rate” adjusts for population; “count” does not.
Data Dashboard — Interactive online tool showing live or recent crime statistics.
Micro-Area Analysis — Studying crime patterns at block or property level.
AI Video Analytics — Algorithms that detect and classify events in CCTV footage.
VSaaS (Video Surveillance as a Service) — Cloud-based monitoring where video and analytics run remotely.
ArcadianAI Ranger — Cloud-native, camera-agnostic AI assistant that turns existing CCTV cameras into intelligent virtual guards.
Conclusion & CTA
Crime data is a mirror, not a verdict. It shows where vigilance, design, and technology must improve.
ArcadianAI’s Ranger platform helps communities transform ordinary cameras into adaptive, intelligent protection networks—without replacing existing hardware.
See ArcadianAI in Action → Get Demo – ArcadianAI

Security is like insurance—until you need it, you don’t think about it.
But when something goes wrong? Break-ins, theft, liability claims—suddenly, it’s all you think about.
ArcadianAI upgrades your security to the AI era—no new hardware, no sky-high costs, just smart protection that works.
→ Stop security incidents before they happen
→ Cut security costs without cutting corners
→ Run your business without the worry
Because the best security isn’t reactive—it’s proactive.