Neighborhood Watch & Crime Rates Across U.S. Neighborhoods — Where Help Is Needed Most
A comprehensive look at the most dangerous neighborhoods in the U.S., built on FBI data, city reports, and police records — with real-world steps for councils, precincts, and watch groups to take action.

Introduction
Neighborhood safety is personal. In the U.S., a small number of neighborhoods account for a disproportionate share of violent crime. According to FBI Uniform Crime Reporting (UCR) data released in 2024, nearly 50% of all violent incidents in major metros cluster in fewer than 10% of census tracts. That means if community leaders, police, and neighborhood watches focus resources where the data points, they can make outsized impact.
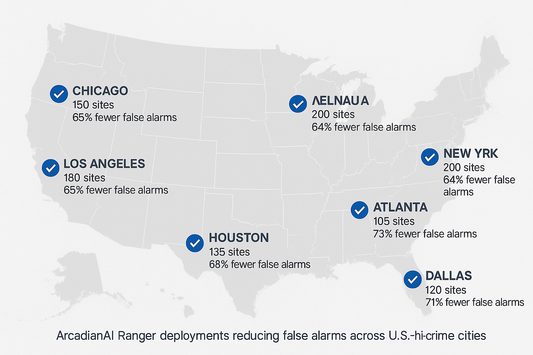
ArcadianAI sees this concentration as both risk and opportunity. Traditional systems — static CCTVs, Ring doorbells, or police-only dashboards — often flood communities with false alarms or miss the patterns behind neighborhood hotspots. Our Ranger platform provides context-aware AI alerts, hotspot mapping, and forensic search tools that neighborhood associations, precincts, and councils can actually act on.
This report goes city by city, neighborhood by neighborhood — Englewood in Chicago, Sandtown-Winchester in Baltimore, North Memphis, St. Louis’ Hyde Park, Detroit’s Warrendale, Philadelphia’s Kensington — to document what the numbers show and how coordinated neighborhood watches can help.
Quick Summary / Key Takeaways
-
Violent crime is highly concentrated in specific neighborhoods.
-
Top hotspots include Chicago (Englewood), Baltimore (Sandtown-Winchester), Detroit, Memphis, St. Louis, and Philadelphia (Kensington).
-
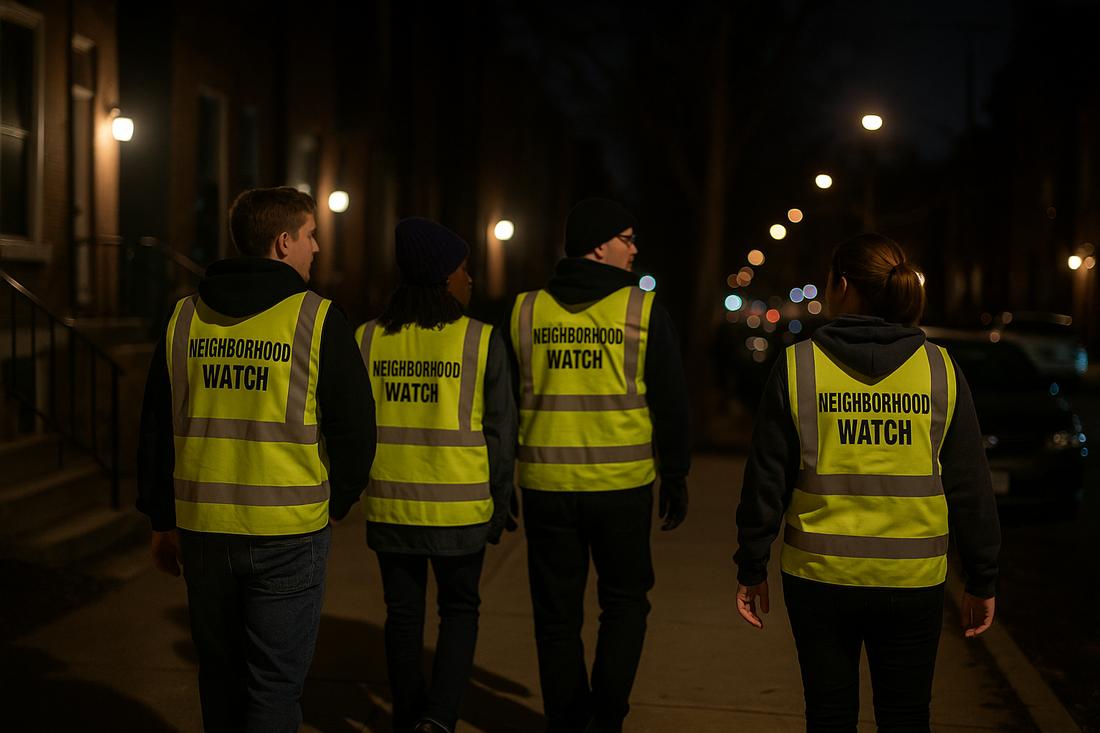
Neighborhood watches fail when uncoordinated; succeed when trained, data-led, and police-linked.
-
ArcadianAI + Ranger enables community centers and precincts to focus resources by reducing false alarms and highlighting true hotspots.
-
Community investment (lighting, youth programs, trauma services) works better than reactive patrols alone.
Background & Why This Matters in 2025
-
The FBI’s 2024 national report confirmed that violent crime rates have plateaued nationally but remain concentrated in specific neighborhoods【source: FBI UCR 2024】.
-
The Council on Criminal Justice 2025 mid-year update shows homicide rates in U.S. cities remain nearly 40% higher than 2019 levels【source: CCJ 2025】.
-
Insurance claims linked to theft, property damage, and shootings in these neighborhoods often raise premiums citywide — impacting even lower-crime communities.
For councils, community centers, and watch groups, this means: tackling hotspot neighborhoods is not just crime prevention, but economic preservation.
Core Exploration
What Makes a “Most Dangerous Neighborhood”?
-
Per-capita violent crime rate (homicide, aggravated assault, robbery, sexual assault).
-
Multi-year persistence (is it a one-year spike or a 10-year trend?).
-
Quality of life indicators: EMS calls, hospital admissions for gunshot wounds, unemployment, abandoned buildings.
-
Community perception: fear surveys, 311 complaints, and visible signs of disorder (graffiti, broken windows).
City & Neighborhood Case Studies
Chicago, IL — Englewood & West Garfield Park
-
Englewood consistently reports violent crime rates 4–5x the city average.
-
West Garfield Park, despite smaller population, has one of the highest homicide rates per 100,000 in the U.S.
-
Local police highlight gang conflicts and economic disinvestment as drivers.
-
Neighborhood watch challenges: volunteer burnout, fear of retaliation.
-
ArcadianAI role: reduce false alerts from cameras, help volunteers focus on genuine threats.
Baltimore, MD — Sandtown-Winchester & Cherry Hill
-
West Baltimore neighborhoods account for nearly one-third of the city’s homicides.
-
Police reports show high clustering of shootings within a 10-block radius.
-
Community leaders emphasize trauma-informed youth programs alongside safety patrols.
-
ArcadianAI role: AI-based hotspot maps, integrating EMS and police data for non-police actors like community centers.
Detroit, MI — Warrendale & Chandler Park
-
Detroit saw a decline from its 1990s peak, but per-capita violent crime remains among the highest in the Midwest.
-
Neighborhoods with abandoned homes experience higher burglary and arson rates.
-
Watch challenges: poor lighting, aging camera systems.
-
ArcadianAI role: camera-agnostic integration, extending life of existing CCTV through AI upgrades.
Memphis, TN — North Memphis & Frayser
-
Memphis had one of the highest homicide rates in 2024.
-
North Memphis and Frayser show double-digit homicide clusters per square mile.
-
Watch groups face coordination challenges; often fragmented by church or block association.
-
ArcadianAI role: unify feeds across multi-location churches, schools, and watch posts.
St. Louis, MO — Hyde Park & Walnut Park
-
St. Louis leads per-capita homicide rankings year after year.
-
Hyde Park and Walnut Park are particularly affected, with violent crime 5–7x national average.
-
Watch groups often rely on Ring Neighbors app — which overreports suspicious “loitering” but underreports assaults.
-
ArcadianAI role: filter bias, provide contextual detection (weapons, fights, trespass) over generic “motion.”
Philadelphia, PA — Kensington
-
Known nationally for its open-air drug markets.
-
Kensington reports very high overdose and violent crime incidents.
-
Watch challenges: blurred line between public health crisis and policing.
-
ArcadianAI role: AI overdose detection (collapse, unresponsive body), supporting both EMS and community health teams.
Comparisons & Use Cases
Table: Neighborhood Watches vs. Traditional Systems
| Feature | Ring Neighbors | Police-Only Patrols | ArcadianAI + Ranger |
|---|---|---|---|
| False alarms | High | Moderate | Very low (AI filtering) |
| Hotspot focus | No (random reports) | Reactive | Yes (data-led maps) |
| Community integration | Weak | Police-only | Strong (council, watch, schools) |
| Scalability | Household-level | Precinct-level | Multi-neighborhood, camera-agnostic |
| ROI | Poor (fear-driven) | Moderate | High (reduced overtime, fewer false dispatches) |
Common Questions (FAQ)
Q: Which U.S. neighborhood has the highest crime rate?
A: West Garfield Park (Chicago) and parts of St. Louis (Walnut Park) consistently rank at the top in per-capita violent crime.
Q: Do neighborhood watches reduce crime?
A: When coordinated with police and trained in observation/reporting, yes. Uncoordinated watches risk escalation.
Q: Are community cameras useful?
A: Yes, if maintained and paired with monitoring. Without AI, false alarms overwhelm police resources.
Q: How can councils justify investing in AI surveillance?
A: Savings in police overtime, insurance claims, and litigation often outweigh costs within 12–24 months.
Q: What’s the difference between “dangerous city” and “dangerous neighborhood”?
A: City rankings (e.g., St. Louis, Baltimore) average data across the city; within them, crime is hyper-localized to small neighborhoods.
Conclusion & CTA
Neighborhood safety is not a citywide abstraction — it’s hyper-local, and solvable when leaders target the true hotspots. Neighborhood watches, councils, and police can collaborate more effectively with data-driven, AI-enabled tools.
ArcadianAI + Ranger reduces noise, filters false alarms, and highlights true risks — empowering community-led safety that works for police, councils, and residents alike.
👉 See ArcadianAI in Action → Get Demo – ArcadianAI
Security Glossary (2025 Edition)
-
Neighborhood Watch — Volunteer groups observing and reporting local safety concerns to police and councils.
-
Hotspot Policing — Strategy focusing resources on small areas with high crime concentration.
-
Violent Crime Rate — Number of violent crimes per 100,000 residents.
-
EMS Data — Emergency medical services data used to cross-check crime incidents.
-
Ring Neighbors App — A community-reporting app tied to Amazon Ring cameras, often criticized for bias.
-
False Alarm — Non-criminal event flagged as crime, often wasting police resources.
-
Context-Aware AI — Surveillance AI that interprets behaviors (fights, collapse) instead of raw motion.
-
Trauma-Informed Policing — Police and community response models acknowledging prior trauma of residents.
-
Community Hotspot Audit — Local review of police, EMS, and resident reports to prioritize safety investment.
-
Per-Capita Homicide Rate — Homicides divided by population, used to compare across neighborhoods.
-
Surveillance ROI — The return on investment for security measures, measured in reduced losses or claims.

Security is like insurance—until you need it, you don’t think about it.
But when something goes wrong? Break-ins, theft, liability claims—suddenly, it’s all you think about.
ArcadianAI upgrades your security to the AI era—no new hardware, no sky-high costs, just smart protection that works.
→ Stop security incidents before they happen
→ Cut security costs without cutting corners
→ Run your business without the worry
Because the best security isn’t reactive—it’s proactive.